Showing posts with label math. Show all posts

Sunday, November 24, 2019

Free Thanksgiving Turkey Worksheets for Kids

Happy almost Thanksgiving!

Free Turkey Worksheets for Kids
I'm just dropping by today to give you a quick link to one of my previous blog posts which contains pictures and links to my free turkey worksheets for kids that I store on my website (www.learningworkroom.com).

They printables are easy to use and no prep! Just print and grab some crayons for the kids. The kids can have some fun reviewing skills and coloring!


Click on the link below:
https://learningideasgradesk-8.blogspot.com/2018/11/free-turkey-literacy-and-math-worksheets.html

Website - www.LearningWorkroom.com

Have a wonderful Thanksgiving with family and friends!


Tuesday, October 30, 2018

2 Free Fun Halloween Printable Math Games

Just stopping by today to remind you that I have 2 FREE fun Halloween themed math games for kids in my TpT store!

The themes are friendly ghosts and spiders!

Click on the pictures to go to my store to get your free copies -

Friendly Ghost Odd and Even Sorting Activity
and Spider Addition with Doubles Matching Game

Both activities are easy to use and fun for the kids!

ACTIVITY #1  Free ODD and EVEN GAME

https://www.teacherspayteachers.com/Product/Odd-and-Even-Numbers-Sort-Halloween-Math-319679
Odd and Even Sorting

ACTIVITY #2  Free ADDITION GAME

https://www.teacherspayteachers.com/Product/Doubles-Addition-Spider-Math-Doubles-Facts-329059
Spider Addition
 
Happy Halloween and have fun with the kids!


Monday, August 20, 2018

Free Telling Time Digital Task Cards

Have you tried BOOM Learning?

Boom Learning is a fairly new website which provides digital learning with FUN, interactive, paperless, self-correcting, digital task cards.

BOOM Learning is a game-changer in the classroom. It helps teachers and students! :)

Try my FREE deck! :) Telling Time to the Hour - Unicorn Theme


https://www.teacherspayteachers.com/Product/Telling-Time-to-the-Hour-Boom-Cards-3849987
Telling Time to the Hour Digital Task Cards hosted at Boom Learning available through TpT
Boom Cards are NO PREP for the teacher. They can be played on interactive whiteboards, computers and tablets. An internet connection is required.

The cards can be played over and over again and are Self-Checking! This is because the cards indicate whether the answers are correct or not. They are also great for homework assignments!


BOOM Learning is a paid subscription site but for a limited time they are giving FREE accounts for Teachers Pay Teachers (TpT) customers new to BOOM Learning.


Boom Learning
Read the following paragraphs from BOOM Learning to learn more about this awesome website.
"Boom Cards live in the cloud. They can't be printed. They play on most modern browsers, Android, iPads, iPhones, and Kindle Fires. You open a Boom Learning account to play them (to protect the children). Create Fast Play pins to assign your Boom Cards to students.

Boom Learning also has premium accounts. Premium accounts offer advanced assignment tools, individual and whole class performance tracking, and more. If you are a new Boom Learning customer, when you redeem your Boom Cards purchase you get 90-day free trial of a premium account. When your trial ends, you can renew or move to a free account. You may upgrade, downgrade or cancel at any time."
Telling Time to the Hour Digital Task Cards hosted at Boom Learning and also available at TpT
I have a FREE deck of Telling Time to the Hour BOOM cards for you to try in my TPT Store. CLICK on the TOP PICTURE to go to my TpT store. There you will learn more about the deck and get your link to download the FREE deck! Plus if you are new to Boom and use the link from my TpT site, you can get the free 90 day trial of the premium account.


If you prefer, here is a link that will take you directly to my BOOM Learning Store. I have lots of other decks in my Boom Store that you may wish to view.

If you are already a member of Boom Learning, this link will take you directly to my FREE Telling Time Digital Task Cards at Boom Learning!

Happy Teaching!


Monday, January 22, 2018

Free Winter Worksheets - Math & Literacy - Grades K-2

Are you in need of some fun winter-themed worksheets for your students?

Here are 3 with a fun winter mitten theme.  (Colors, Syllables, and Parts of Speech)


www.LearningWorkroom.com
COLORS
www.LearningWorkroom.com
Syllables

Parts of Speech

Just click on any of the pictures above to go to my website to download your free copies.

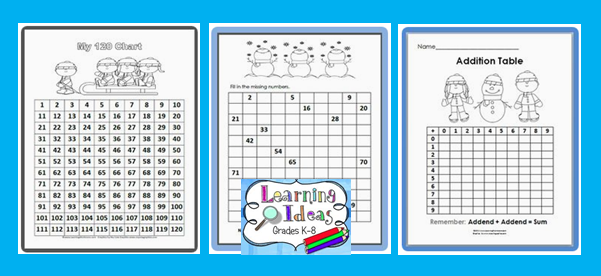
I also have some math worksheets for you.  (120 Charts and an Addition Table)


www.LearningWorkroom.com
Math Worksheets

Just click on the picture to go to my website to download these also.

If you are looking for more Winter-Themed ideas, please visit my Pinterest Boards!!!


https://www.pinterest.com/marcia_murphy22/winter-teaching-ideas/
Winter


Happy Winter and Stay Warm!!!


https://www.pinterest.com/marcia_murphy22/february-teaching-ideas/
February

Saturday, February 12, 2011

Rainbow Tally Chart and Graph

Math Lesson


In the previous lesson, the kids learned that white light is really made up of the 7 colors in the spectrum.
In this activity, children can conduct a survey to find out their family and friends' favorite colors in the spectrum. They can follow up that activity by making a graph to display their data.

Materials
  • clipboard or notebook
  • pencil
  • ruler
  • crayons or markers

Directions
clipart by www.graphicsfactory.com
  • Have students make a list or chart of the 7 colors of the color spectrum (remember ROY G BIV).
                *red
                *orange
                *yellow
                *green
                *blue
                *indigo
                *violet
  • Have students poll their family and friends as to their favorite color. They should mark a tally for each vote.

  • Next they could count the votes and create a tally chart or frequency chart with their data.
Tally Chart


Frequency Chart

    • Older children should use the data in the tally chart to create a bar or other graph to display their results.The graph should include:
                         ~ title
                        ~ 7 columns (for the 7 colors)
                        ~ 2 labeled axis
                         ~a numerical scale starting at zero
    • Finally students should explain their data (oral or written). Which color had the most votes? Which color had the fewest votes? Etc.
    • More advanced math students can also find the mean, medium, mode, maximum, minimum, and range for the data.

    Friday, January 14, 2011

    Reading Your Electric Meter

    A Math Activity


    If you have access to the electric meter in your home or building, you can read the meter to see how much electricity is being used each day. (Most meters have 5 dials.)

    Steps:
    • Record the readings at a specific time of day by recording the numbers displayed on the dials.
    • The next day, at the same time, record the numbers displayed on the dials.
    • Subtract yesterday's reading from today's reading and you can get an idea of how much energy (kilowatt hours) is used in one day.
    • Have the children continue with their readings for a few days. Then they can put the data in a chart or create a graph of the data.  
    • Younger students can calculate the amount of electricity used in 3 days or 7 days, etc. Older students can also find the average amount of electricity used per day.

    Thursday, December 16, 2010

    Planet Survey & Data Charts

    To combine science and math children can conduct surveys.

    clipart by www.graphicsfactory.com

    A clipboard is a good tool to use, but if you don't have a clipboard(s), the kids can use their science or math notebooks.
    • First have children make a list of the 8 planets.
    • Next they should conduct a  survey of their family, friends, classmates, etc. to see which planets are their favorites.
    • Then they could make a tally chart or bar graph to display their data.

    Monday, December 6, 2010

    Earth's Rotation


    clipart by www.GraphicsFactory.com


    Earth's Rotation (turning or spinning on its axis) causes Day and Night.
    One way to demonstrate this science concept is to use a globe to represent the Earth and a flashlight to represent the Sun. Demonstrate that if the Eastern Hemisphere is having day then the Western Hemisphere is having night. 

    1 Earth Rotation takes approximately 24 hours.

    Vocabulary: rotate rotation, day, night, Earth, axis

    Younger students can pretend that they are the Earth and "rotate" showing day and night.

    Older students can draw a picture and EXPLAIN why half the Earth has day while the other half has night.

    Monday, November 29, 2010

    FREE Online Dictionary

    Whatever the topic.......animals or something else....it is important to have a good dictionary.
    .
    Here is a wonderful one!

    CLICK HERE: http://www.merriam-webster.com

    clipart by www.GraphicsFactory.com

    This online dictionary will even pronounce the word for you! :)

    Wednesday, November 24, 2010

    Use a Venn Diagram to Compare Animals

    I think Graphic Organizers are great for kids! An easy one to use is the Venn Diagram where you get to compare and contrast 2 or more things.

    A simple Venn Diagram has only 2 circles that overlap. In the center, where the circles overlap, is where you list how the 2 things are alike and the outer circles are for listing how the 2 things are different.

    Let the kids compare 2 or more animals using Venn Diagrams.
    For example, they could compare and contrast a dog and a frog.

    They are alike in that they both have a backbone and they both have 4 legs.

    They are different because the dog is a mammal and warm-blooded, whereas the frog is an amphibian and cold-blooded.


    Older students can compare 3 or more animals in each Venn Diagram (just add more circles). They can also use the facts in their graphic organizer(s) to write an essay about their animals.

    You can visit Learning Workroom's website for a FREE Venn Diagram Worksheet that you can download and print.

    Click on "Free Worksheets

    Tuesday, November 23, 2010

    Measurement and Animals


    It's MATH TIME!

    Materials
    • ruler(s)
    • tape measure(s)
    • yard stick(s)
    • meter stick(s)
    • stuffed animals
    • toy animals
    • pencil
    • science notebook

    Get out the rulers! Look for both centimeter and inch rulers. Have the kids measure their stuffed animals and plastic toy animals. This works especially well with those rubber snakes that most kids seem to love! They can see which snake is the longest and which is the shortest. They can measure all their animals (height and width) and record their findings (data) in their science notebooks. Whenever they get a new stuffed animal they should get its measurements and add the data to their list.

    Let the kids also practice measuring with a tape measure and a yard stick or meter stick if the objects are large. They should record all their data.

    Older students should organize and display the data using a table or other graphic organizer.


    Saturday, November 20, 2010

    Animals and Data Analysis

    This is a MATH Extension lesson to the Animal Classification Activity with stuffed animals.


    • Have the children estimate the number of stuffed animals that they have in each display. (How many mammals, reptiles, amphibians, etc.?????)
    • Then tally the number of animals in each group and create a tally chart. (Compare the numbers.)
    • Lastly, graph the number of animals in each group. Compare.  Which group has the most? Which group has the least?  Do any groups have the same number?
     
      Here is a MATH VIDEO from Brain Pop Jr. called Tally Charts and Bar Graphs to introduce or review Surveys, Tally Charts, and Bar Graphs.
      Click here: Brain Pop Video

        • An extension activity for older students is to find the Mean, Median, Mode, Maximum, Minimum, and Range from the Data in this activity.
        • Students can also record and display the data using tables, line plots, etc.


        Tuesday, November 16, 2010

        LinkWithin

        Related Posts Plugin for WordPress, Blogger...

        LinkWithin

        Related Posts Plugin for WordPress, Blogger...